2026-04-08")

")
Our proprietary “doubled-barreled” oversold signal flashed on Oct. 20 after the closing bell. A relatively uncommon signal, our double-barreled signal is historically coincident with the SPDR® S&P 500 ETF Trust (NYSEARCA:SPY), Invesco QQQ Trust ETF (QQQ), and iShares Russell 2000 ETF (IWM) approaching an intermediate and long-term bottom.
Historically, “double-barreled” oversold readings have preceded returns that are more than two times normal over the ensuing year, with a 100% success rate over the past decade.
What constitutes a double-barreled signal
A double-barreled oversold reading is based on two distinct measures based on our custom 1,600 stock universe.
Our universe is unique because it comprises institutional quality stocks trading over 100,000 shares daily with market caps above $300 million at the time of inclusion. Since it cuts across small, mid, and large-cap stocks that large money managers find most interesting, it is a broader stock market gauge than the S&P 500 (SP500), NASDAQ 100-Index (NDX), or Russell 2000 (RTY).
The first indicator is our weekly overbought/oversold measure of stock price strength relative to historical price trends. Specifically, we calculate the percentage of stocks in our 1,600 stock universe that are trading greater than 5% above the 200-day moving average.
Historically, when this measure is below 20%, it is coincident with the stock market being oversold, and readings below 10% are extremely oversold.
For instance, this measure dipped below 20% on March 5, 2020, and it reached a selloff cycle low reading of 1.7% on March 26. Buying during the month of March 2020 was very rewarding.
In 2022, we hit a selloff cycle low of 8.2% on September 29. Again, this provides significant returns over the ensuing year.
The second component of our “double-barreled” signal is based on the average score of stocks in our universe.
Weekly, stocks in our universe are ranked across seven factors, including technical and fundamental data points such as earnings beats, earnings growth, price trends, and seasonality (our methodology can be viewed here).
When the average universe score falls below 50, it’s typically coincident with stocks being oversold.
This signal has triggered fewer than 25 times in the past decade, and usually near the end of sell-offs.
For example, it last triggered on Sept 29, 2022, ahead of a 25% rally in the S&P 500 over the following 240 days. It similarly coincided with lows in 2015, 2016, and 2020.
In instances when both of these indicators flash oversold simultaneously — a “doubled-barreled” signal, it’s preceded significant returns over the following 240 trading days, with a 100% win rate.
Few Stocks Are Meaningfully Above Key Levels
As of the close on Oct. 20, just 18% of our universe is >5% above the 200-DMA, a level that’s historically in the ballpark of oversold reversals.
The percentage can fall below 10% at major inflection points, signaling extreme fear. Nevertheless, readings below 20% are historically a good spot to begin shifting from selling to buying stocks.
The percentage of stocks 5% or more above the 200-DMA is historically coincident with oversold. (Limelight Alpha.)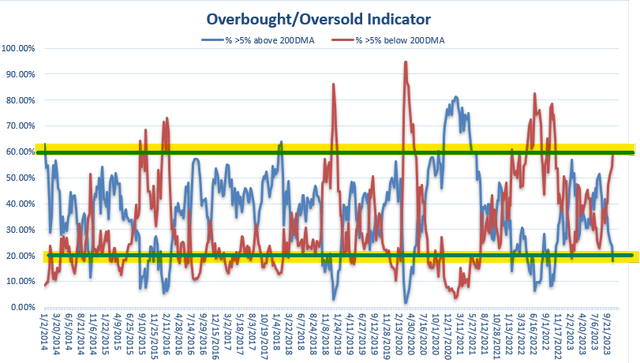
Over the past decade, there have been 73 weekly readings below 20%, including consecutive weekly readings. The average and median return in the following 240 days is 19.5% and 17%, respectively, with a 97% win rate.
That’s pretty good, but returns are much better after double-barreled oversold readings.
There have been 22 occurrences of a double-barreled reading this past decade.
Historically, the SPDR® S&P 500 ETF Trust has risen by an average and median of 29.8% and 27.3% over the following 240 trading days, with a 100% win rate.
That’s significantly higher than the 12.2% average 240-day return following all weeks over the period.
A double-barreled buy signal often coincides with major market lows. (Limelight Alpha)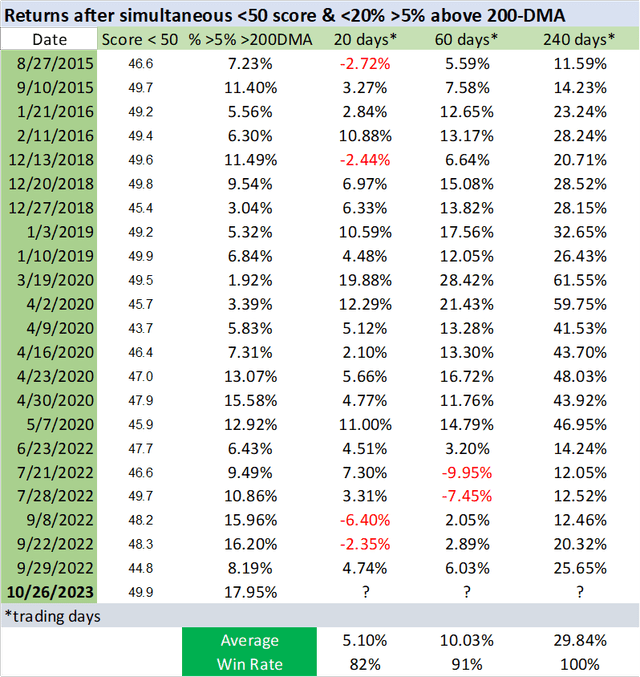
How to trade a double-barreled signal
Short-term traders should use downside volatility to cover shorts or run trailing stops to protect downside gains. This signal doesn’t pick the day of the low, and as you can see, the win rate over the following 20 trading days falls to 82%. You’ll also notice that this signal can persist for weeks. Therefore, the bias should be toward buys, but short sales can still work while the market action becomes more violent as a low gets established.
Intermediate and long-term investors can consider increasing contributions to dollar-cost averaging programs in retirement accounts and similarly, increase or institute dollar-cost averaging with individual stocks on watch lists.
Returns can be high for heavily shorted, low relative strength stocks because of mean reversion. However, that’s a risky strategy. Be careful shorting or buying stocks with high short interest and low relative strength scores following a double-barreled signal, especially stocks trading significantly below the 200 DMA.
High beta stocks can whip account balances significantly day to day in periods like this, so the margin is also dangerous. High volatility means stop losses are at an increased likelihood of being triggered in both directions, compounding losses.
Instead, better risk-to-reward can be achieved by focusing on the top-scoring stocks in the best-scoring industries, within the top-rated sectors.
Every week, we rank the major market sectors and industries, highlighting the highest-scoring stocks within each. Sector and industry scores are compiled by aggregating individual stock scores in our universe.
For example, this past weekend’s Best & Worst Large Cap ranking shows the best sectors to buy are energy, industrials, technology, financials, and services.
Focusing on individual stocks within those best baskets, or related ETFs, such as the (XLE), (XLI), (XLK), (XLF), and (XLY), can pay off.
Energy, industrials, and technology are the strongest large cap sectors. (Limelight Alpha)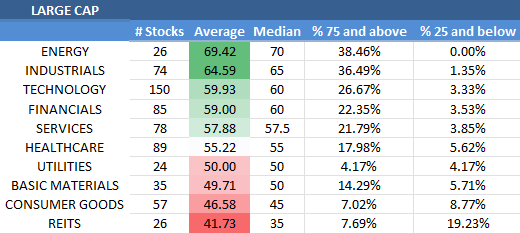
Furthermore, the following industry ranking from this week’s large-cap report highlights top and bottom-scoring industries by sector, allowing you to drill down even deeper for stock or ETF selection.
For instance, insurers, or the insurance ETF, SPDR® S&P Insurance ETF (KIE), offer better risk to reward than regional bank stocks, or the regional bank ETF, SPDR® S&P Regional Banking ETF (KRE).
Industry rankings help investors narrow their focus on the best stocks. (Limelight Alpha.)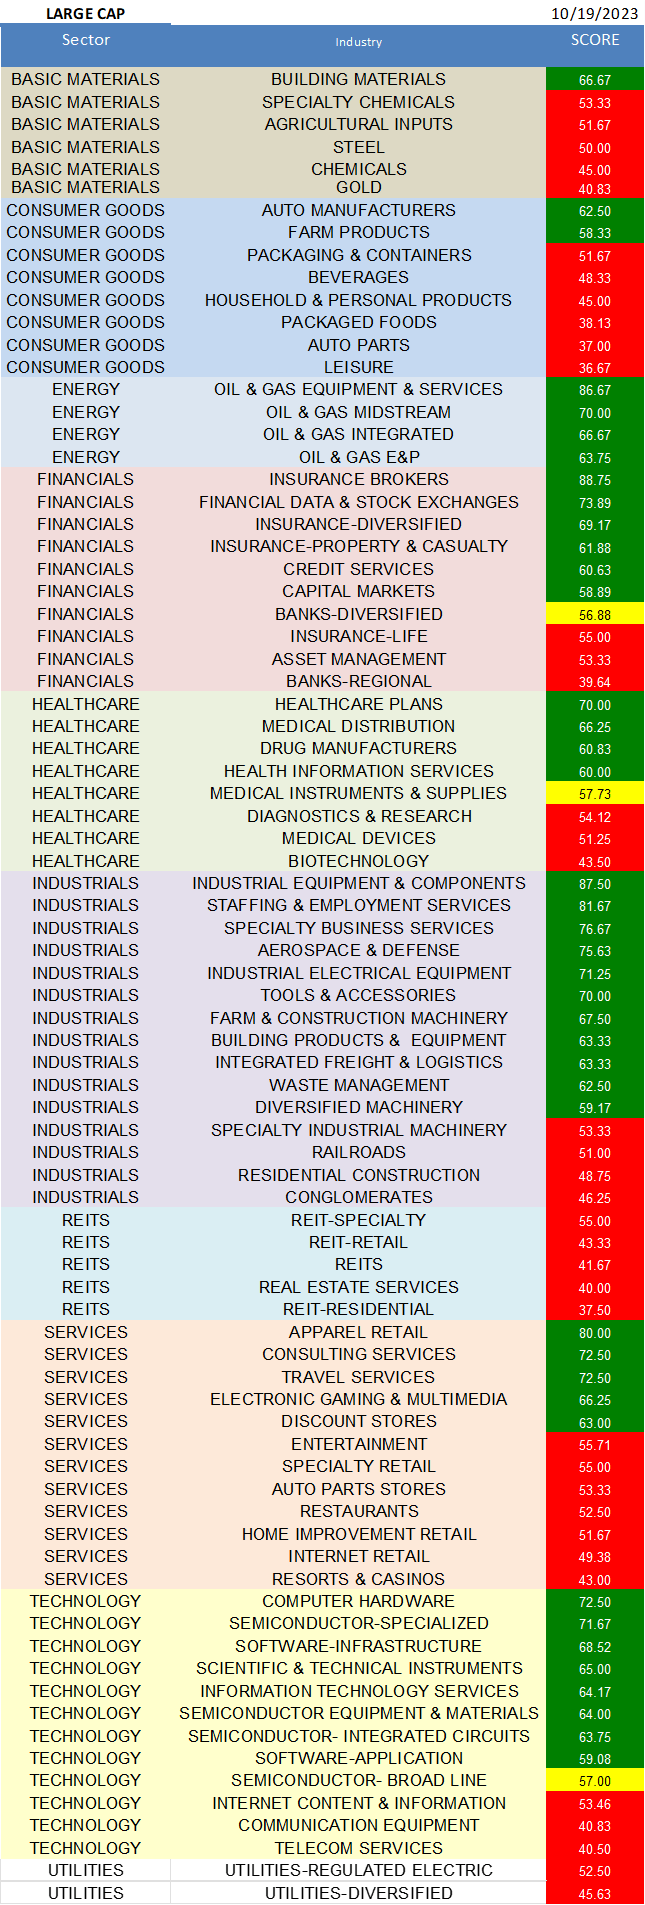
Overall, history doesn’t repeat, but it often rhymes, as the saying goes.
A double-barreled signal suggests it’s time to focus on the stocks you want to own for the next 52 weeks.
Investors who have shifted bias to net long from short have been rewarded nicely after similar signals in the past.
Sentiment measures to also watch
Additional conviction that the stock market sell-off is near its end can come from similar oversold readings on sentiment indicators, including a spike in the volatility index, a high put/call ratio, a low National Association of Active Investment Managers (NAAIM) Exposure Index, and low bullishness in the American Association of Individual Investors (AAII) Investor Survey.
The S&P VIX Index (VIX) has increased to its highest since the March low, above 21. Readings above 25 were actionable this past spring, with a peak above 30.
The CBOE total Put/Call ratio measuring bearish put activity to bullish call activity finished Friday, Oct. 20, above 1 at 1.06. Readings above 1.2 can be particularly actionable. It reached 1.59 (a year-to-date high) at the low on October 4.
The NAAIM Exposure Index bottomed at 36.21 on October 4, near the levels seen at the August low and slightly below levels at the low in March. Exposure has since increased to 66.7.
NAAIM’s Exposure Index (NAAIM)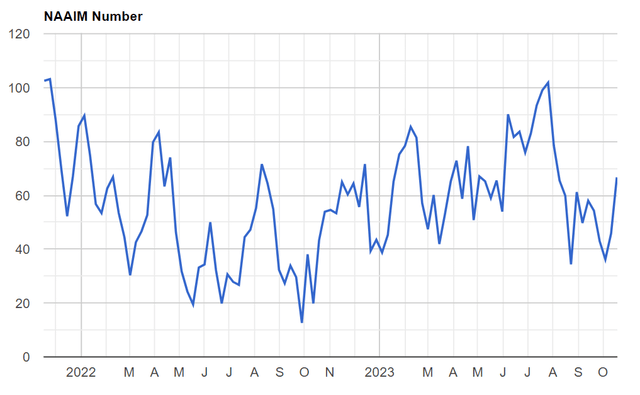
AAII Sentiment Survey bullishness reached a low of 28% on Sept 28, the lowest since a 27% reading near the low in May. It climbed alongside stocks in early October to 40%, but bullishness rolled over last week, slipping to 34%.
AAII Sentiment (AAII)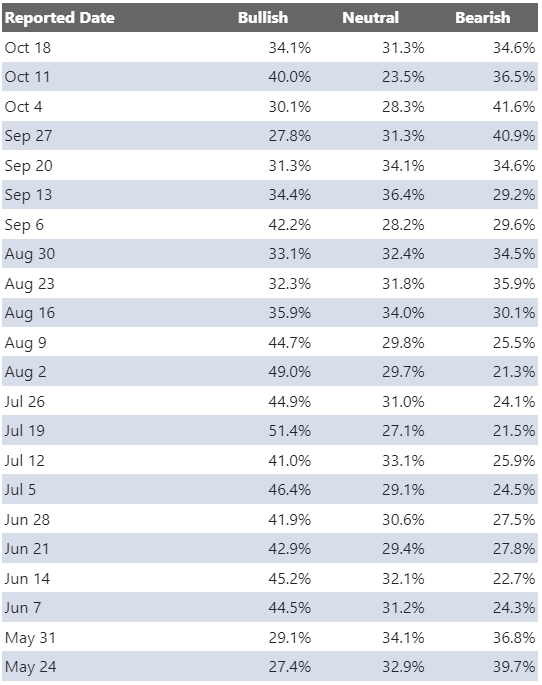
CNN’s Fear/Greed Index, which comprises a slate of sentiment data, can also be useful at inflection points. It is currently flirting with Extreme Fear.
CNN’s Fear/Greed Index (CNN)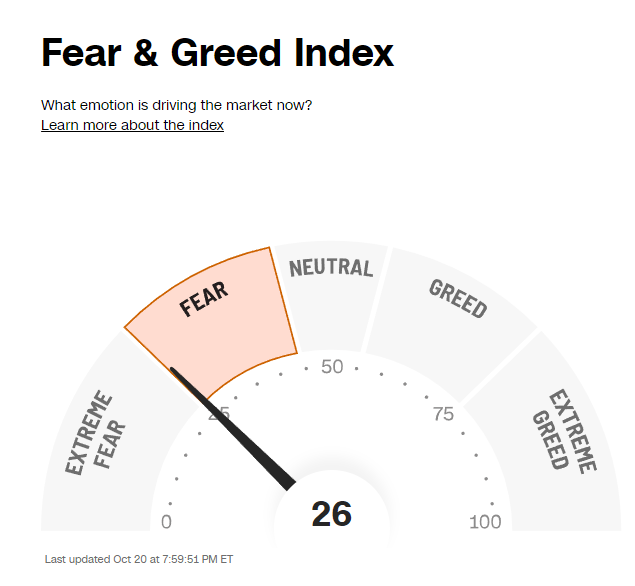
The NAAIM Exposure and AAII sentiment aren’t at their lows currently. However, weakness this week may cause those measures to retreat, or perhaps, prior readings in late September/early October were the lows of this cycle.
The VIX is similarly elevated but not extreme. That could change if we get more weakness this week.
Since bottoms are often made on intraday reversals, with major indexes including the S&P 500, NASDAQ 100, and Russell 2000 opening weak and finishing the day higher on heavy trading volume. If we see such an intraday reversal, it would add even more conviction that a bottom is forming.
Overall, our “double-barreled” signal means the odds are tilted toward buyers. If these measures worsen, it would further improve the odds, making buying even more compelling.
Read the full article here
 2026-04-08")
")
 (NASDAQ:MU)")
")