(NASDAQ:MU)")

")

My family’s charity hedge fund looks nothing like what I would build if I were starting from scratch today.
Nor is it the simplest way to earn maximum safe yield with zero stock picking risk.
- The Best Way To Invest $1 Million And Earn $53,000 In Annual Dividends
What My Family Hedge Fund Looks Like Today
Morningstar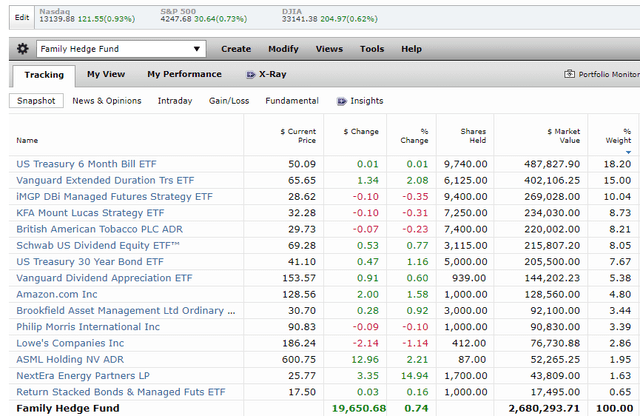
For months, my family has been ravaged by medical crises, most recently my 26-year-old sister’s diagnosis with metastatic thyroid cancer.
Even though she has insurance, the out-of-pocket costs will be at least $15,000. And the chemo and radiation? Her oncologist tells us that the radiation pills are $2,000 each.
Thank god my family’s income, combined, is around $800,000 per year, and we have this portfolio of world-beater blue-chips.
We are expecting things to get even worse next year, with my sister’s chemo potentially boosting our current monthly expenses from $25,000 to perhaps $30,000.
With a recession with a 96% probability next year and a 20% to 30% market decline in the base case for 2024, my family is bunkered down in cash, bonds, and managed futures to prevent us from having to become forced sellers in a potential market crash.
Most families would have gone bankrupt by now, overrun by medical bills (and we have insurance!). We’re fortunate to have the resources to pay whatever it takes and still survive…so far.
Our $500,000 war chest is there just in case we get hit with unexpected out-of-pocket expenses such as my Grandmother’s brain cancer returning, that surgery cost $600,000.
Inflation has been the highest in four decades in recent years.
Truflation 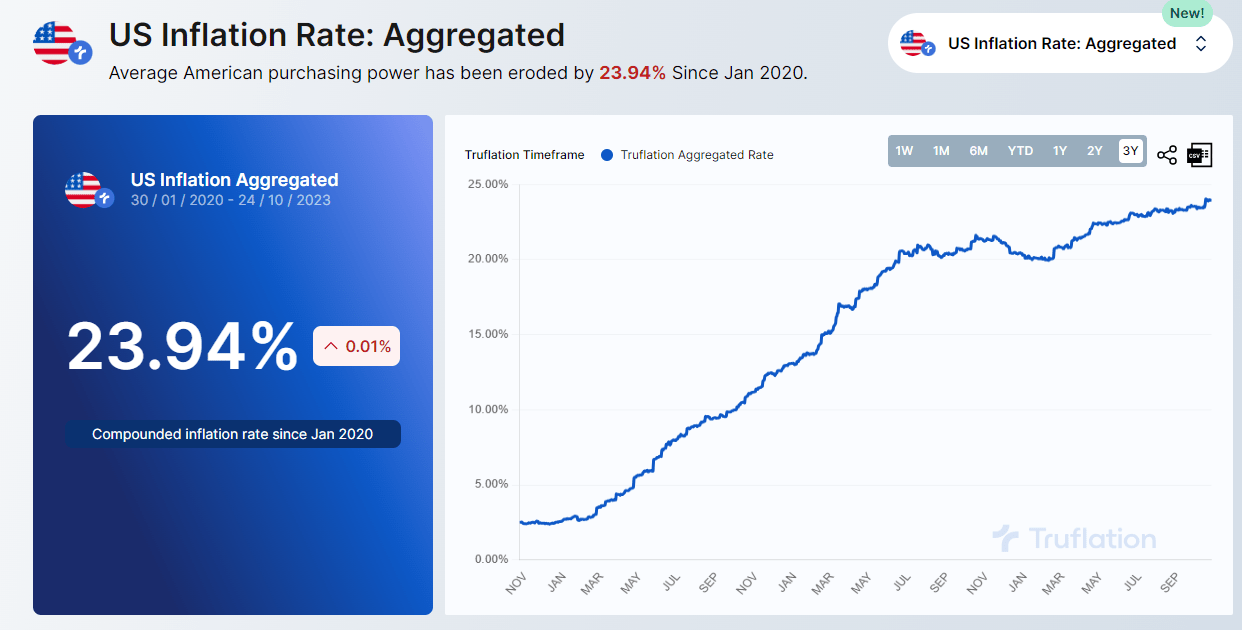
Inflation is 24% over the last three years, 7% annually, the same as the average inflation rate of the 1970s.
Truflation 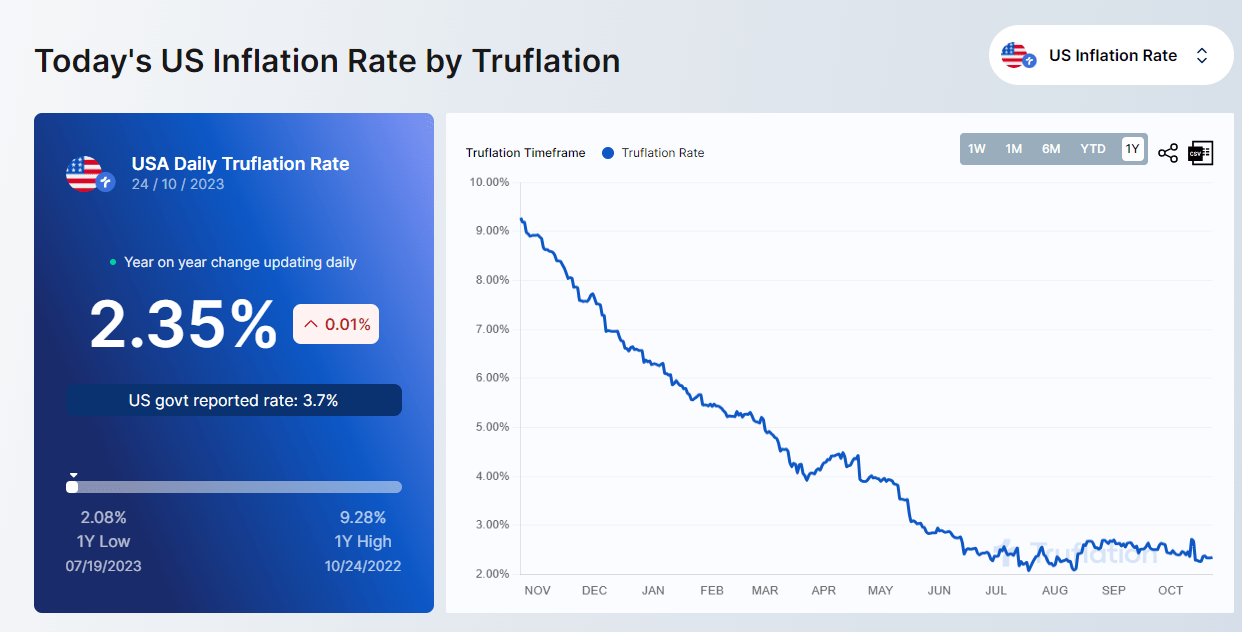
The good news is that inflation has reached the Fed’s target.
The bad news? Inflation above zero means we’ve locked in the price increases of the last few years.
Charlie Bilello 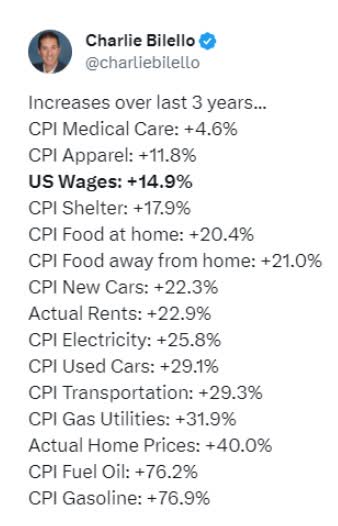
My personal inflation rate is 500% in the last year due to lots of medical crises and out-of-pocket expenses.
Most people have experienced much less in the last few years, but many still struggle.
Daily Shot 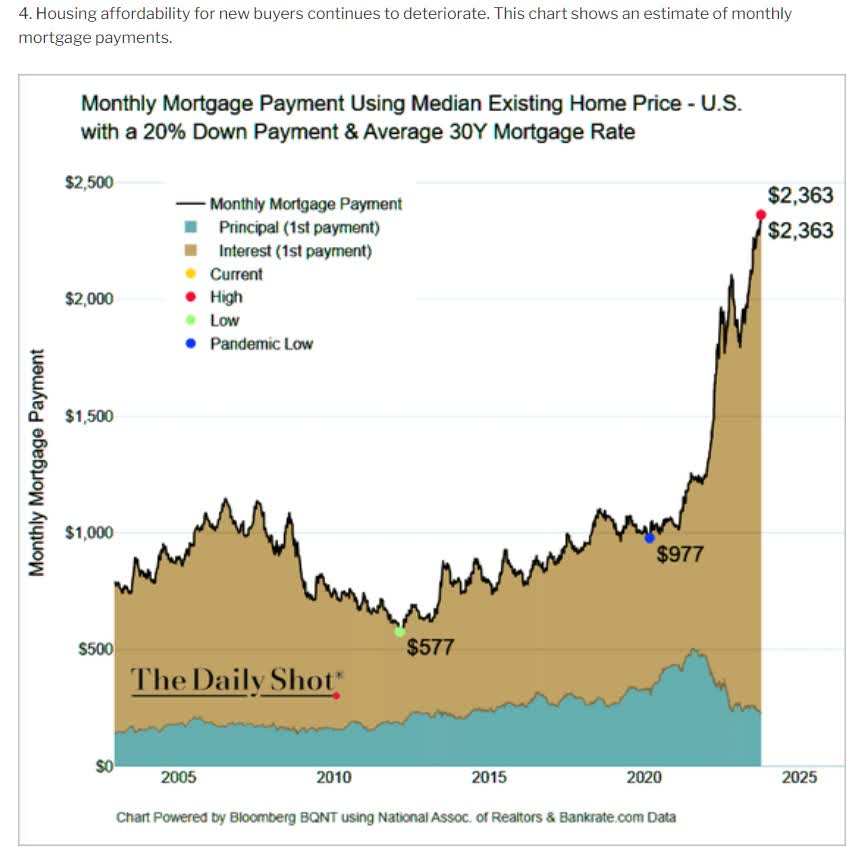
If you’re trying to buy a home? Like 150 million Millennials and GenZers are expected to in the coming 20 years? Well, you’re pretty much in trouble.
- I’m going to have to buy a home for my family as soon as I start one
- Thankfully, I will have the ability to pay up through the nose for a house
When my parents bought their home in my hometown in 1997, they paid $107,000.
Today, a basic home in my hometown is $500,000.
The Worst Home Affordability In 85 Years
Daily Shot 
Fannie Mae was set up in 1938 to help Americans afford homes in the Depression.
Not since then have US homes been less affordable.
Daily Shot 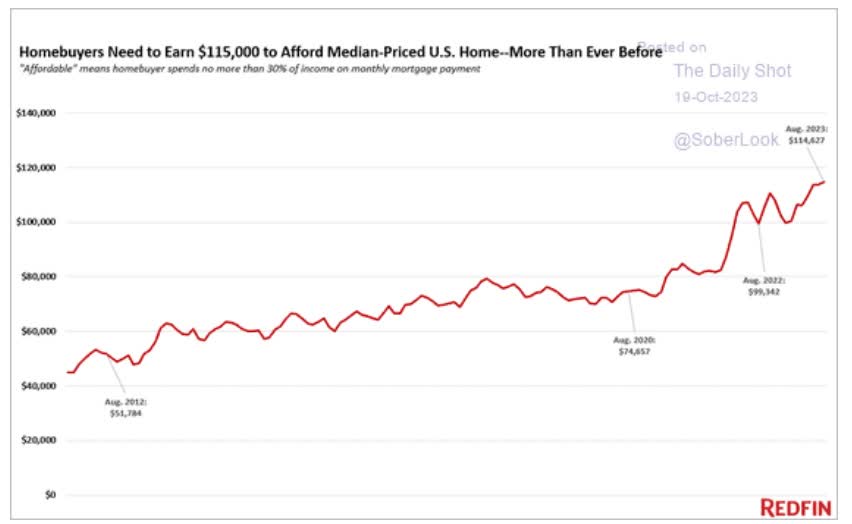
Unless you make $114,000 per year, you can’t afford the average US home.
Charlie Bilello 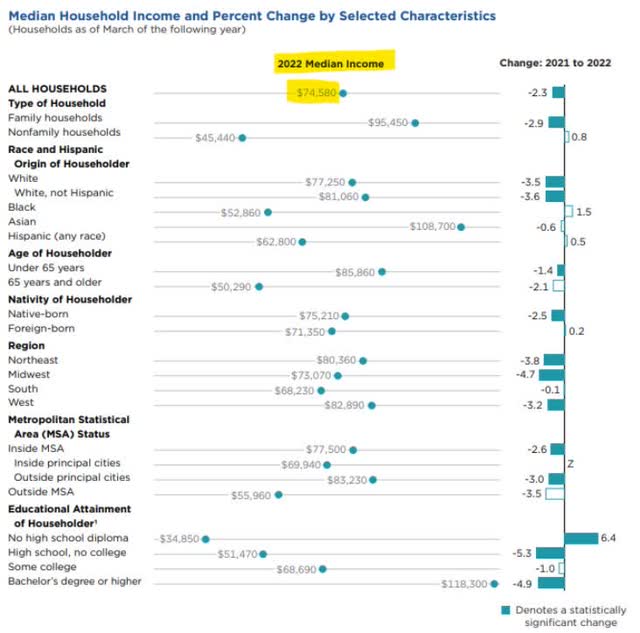
The median US household makes $75,000, and only college graduates can afford to buy the average home.
Can you see why Americans are so upset about inflation? These prices are never coming down; they are permanently higher, and I’m fortunate that my family can afford to pay whatever it takes to keep my loved ones alive and healthy (relatively speaking).
The Good News For Savers
Ycharts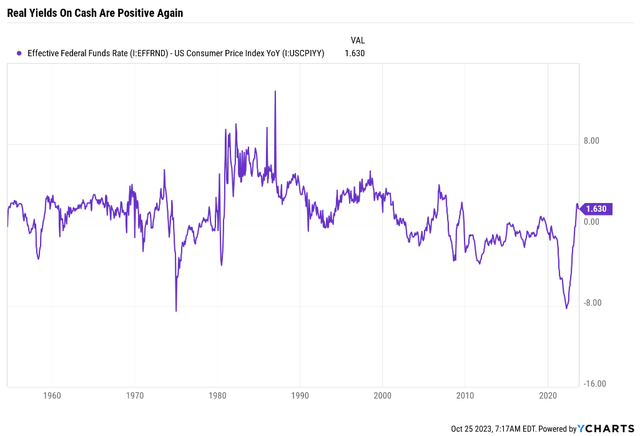
For the last 15 years, real yields on risk-free cash were negative most of the time.
Ycharts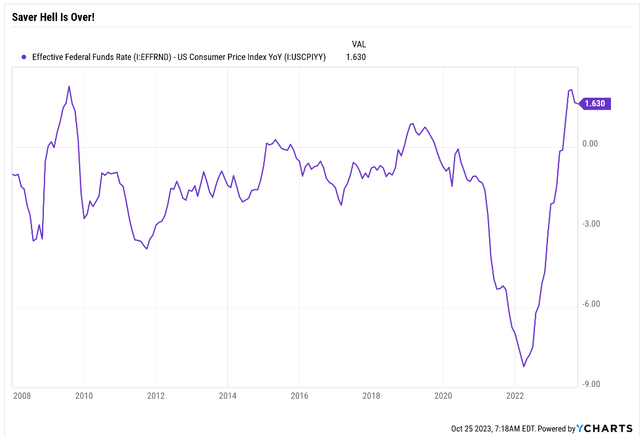
How freakish was this?
Ben Carlson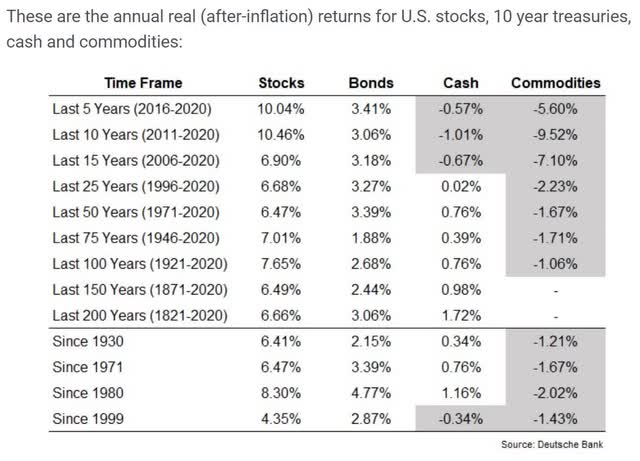
Cash has historically yielded 1.7% after inflation, with bonds yielding about twice as much as stocks delivering 4X better returns.
Ben Carlson
Only in the 1910s and 1940s, due to World War-induced inflation, has cash returned worse negative rates than in the last 15 years.
depositaccounts dot com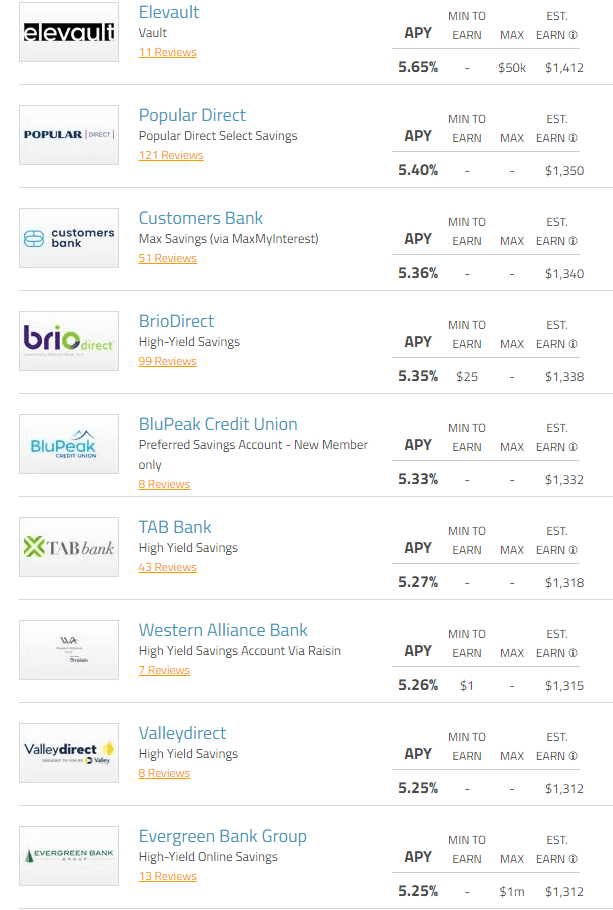
Today, you can get a high-yield savings account yielding as much as 5.65% and 5.4% with no max account size.
My bank offers 4.5%, and since I have all my accounts linked to it, it’s not worth the hassle to yield chasing whatever offers the best risk-free yield.
And especially not when the US Treasury 6 Month Bill ETF (NASDAQ:XBIL) offers us 5.6%.
Why I Have $500K Invested In This 5.6% Yielding ETF
Cash is a risk-free asset with virtually no duration risk.
CNBC 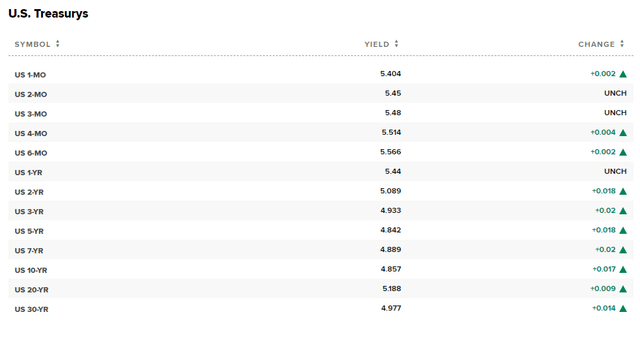
Two years or less duration US treasury bonds are considered cash, and it’s recommended any money you absolutely need (or might need) in the next three years should be invested in risk-free cash (FDIC-insured accounts including CDs or HY savings) or T-bills.
Right now six month T-bills are yielding the most, and they have basically no duration risk.
- If rates go up 1%, 6-month treasuries fall in value by about 0.6%
Ycharts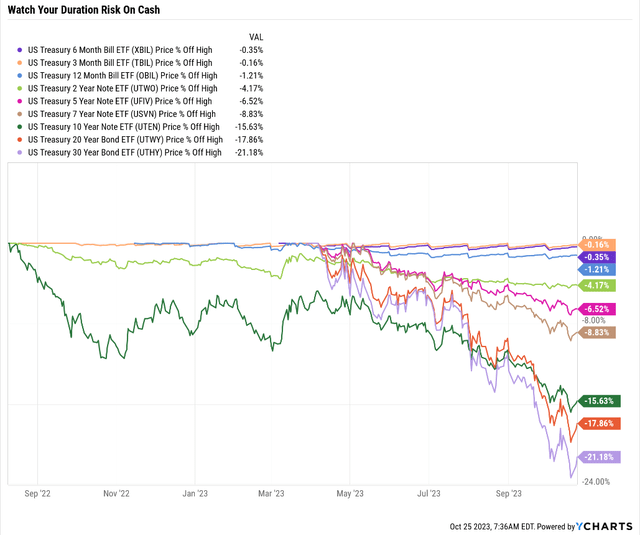
You can see the importance of keeping your duration short regarding cash.
Even with rates soaring at the fastest rate in 42 years, cash has been cash, retaining its value.
Ycharts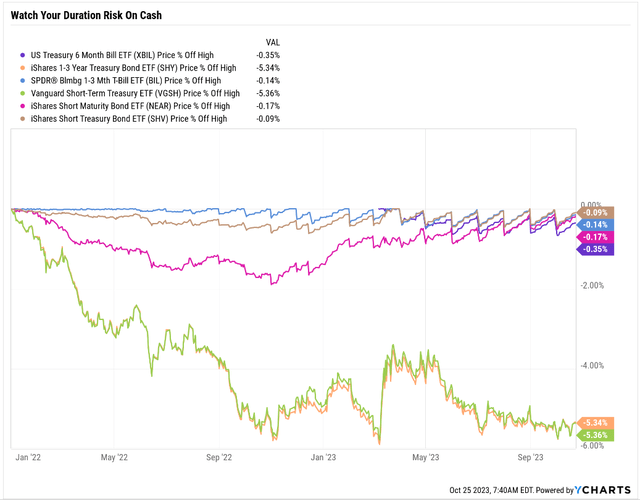
Why XBIL and not one of the other alternatives like SHV, BIL, or VGSH?
Why My Family Trusts XBIL For Our Emergency Fund
Seeking Alpha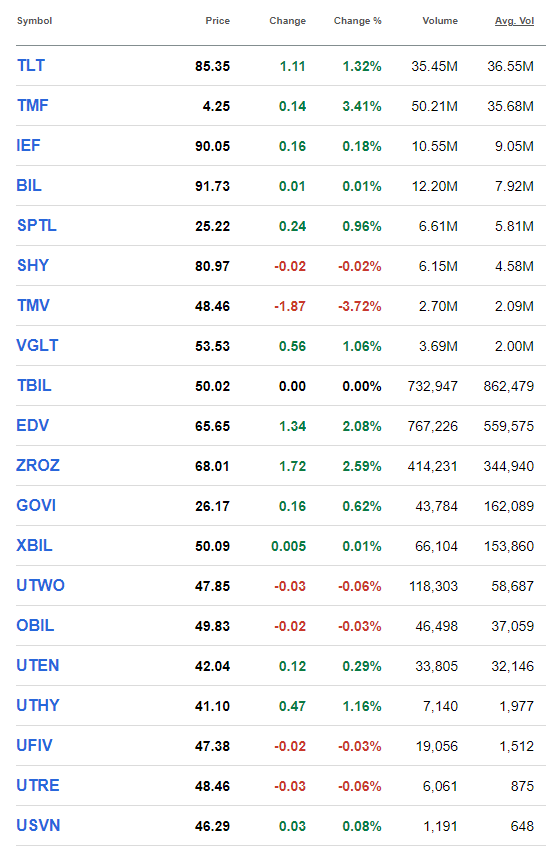
XBIL’s 160,000 average daily volume is $8 million in daily trading volume and even on a weak volume day, we can sell 100% of our position with no liquidity risk.
The #1 driver of ETF liquidity is the asset itself.
If a hedge fund wanted to buy $1 billion worth of T-bills via XBIL via a market order, it would not significantly move the price because 6-month treasury bonds are so liquid.
UStreasuryETF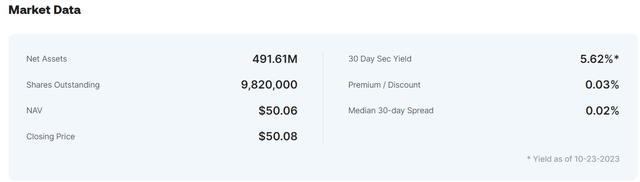
The spreads on T-bill ETFs are non-existent. You can buy or sell as much as you want without worrying about limit orders.
UStreasuryETF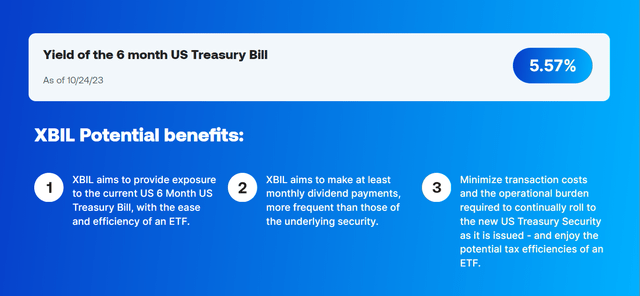
XBIL pays monthly, just like many cash ETFs, including iShares (SHV) and Vanguard (VGSH).
The yield is effectively the same, and what about the cost?
Morningstar Morningstar Morningstar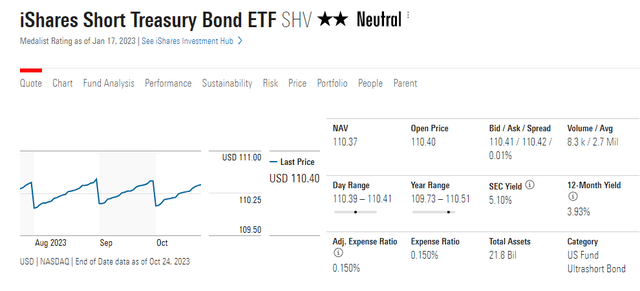
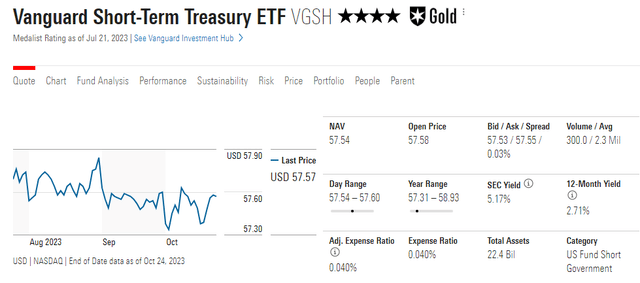
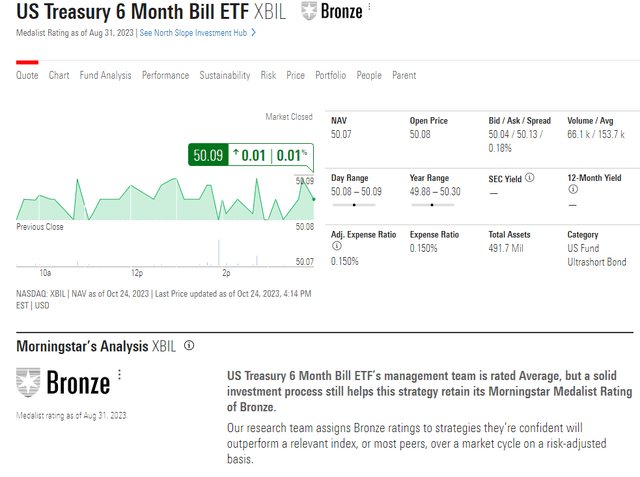
The range of expense ratios for these ETFs is between 0.04% and 0.15%.
- XBIL’s latest monthly dividend is $0.22481 or 5.4% yield
XBIL has a higher expense ratio than Vanguard, but the 5.4% post-expense ratio yield is superior to VGSH’s 5.1%.
And the biggest reason I like the US Treasury Bond ETF series?
It’s complete duration control.
Each ETF owns a single US Treasury bond; there are no ranges.
US Benchmark Series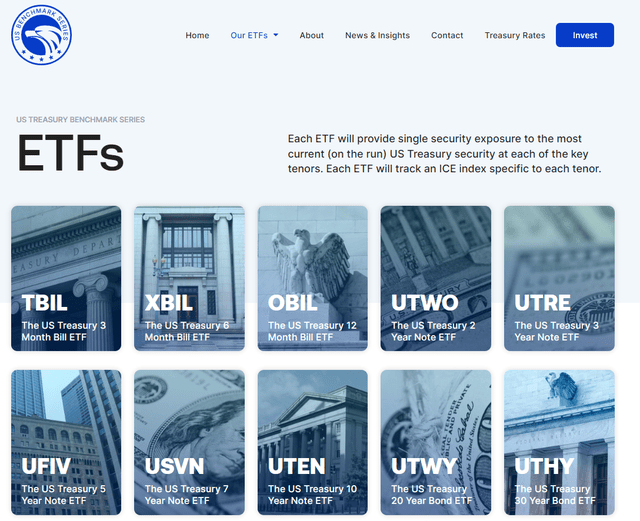
Most bond ETFs have a range of maturity. Here, it’s one bond, and the most recent one, at all times.
- every week or two the US Treasury sells new 6 month T-Bills and XBIL is rolling over to the most recent one
Should inflation spike and rates rise further, the US Benchmark series will be the fastest to take advantage of higher rates.
No ETF will increase its yield, and banks will naturally drag their feet on raising high-yield savings accounts.
- Unless you want to jump from account to account chasing the highest FDIC-insured yield in America
How Much Is Inflation Risk Right Now?
For three straight months, headline inflation has been rising, and Goldman thinks it will peak at 4% to 5% by January before it starts falling as financial conditions tighten.
Daily Shot 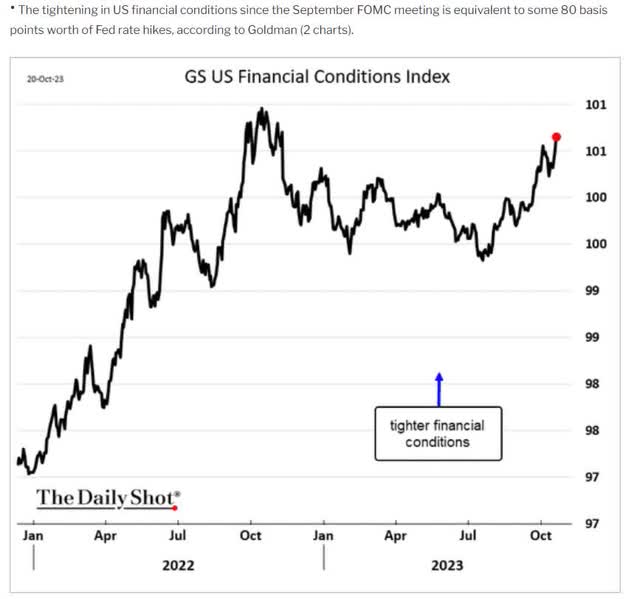
That’s good news, at least for anyone worried about inflation.
Ycharts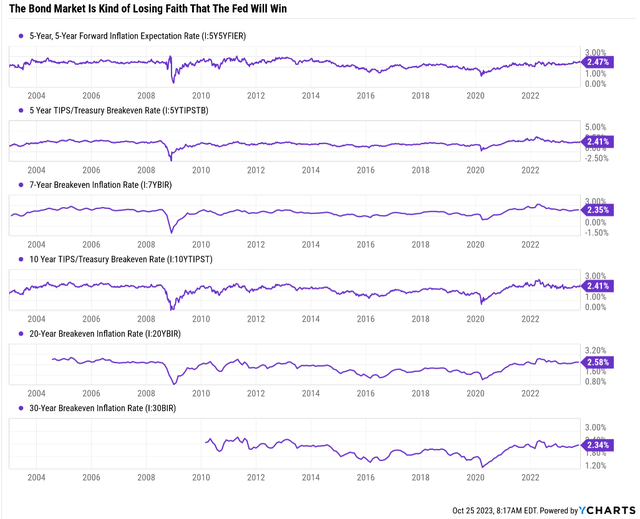
So far, the bond market isn’t that worried about the Fed losing control of inflation. If that changes though?
Why You Shouldn’t Keep Cash In Bonds
Daily Shot 
The other two major inflation cycles we’ve had were in the 1940s and 1970s.
Each time, there were three spikes in inflation.
My family owns over $500,000 worth of 30-year bonds to hedge against recession.
But if we avoid recession or inflation spikes higher?
A repeat of the 1970s (worst case scenario) would lead to 11% inflation by 2028 and, most likely, the Fed having to hike to between 12% and 15%.
- 10% to 15% 30-year yields
Obviously, you don’t want to have a volatile asset like long bonds storing your emergency funds.
What About Managed Futures?
Wide Moat Research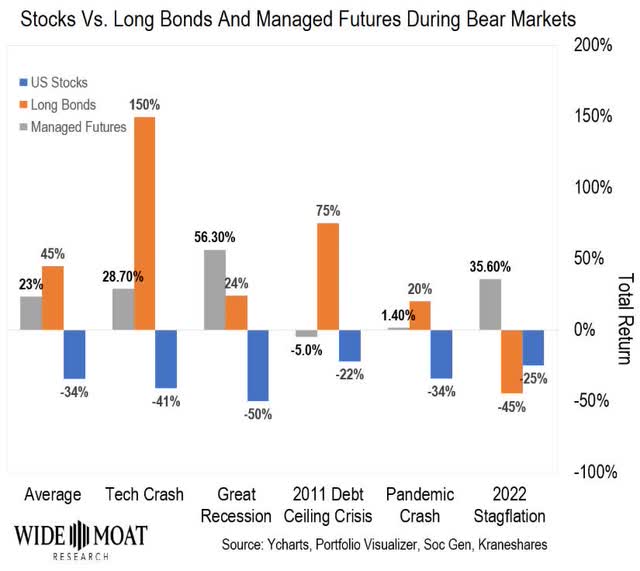
Bonds and managed futures are the best hedging strategy of the last 50 years, including the 1970s stagflation hell.
- managed futures soared almost 800% in the 1970s
So why not put the cash into KMLM, the king of managed futures?
Krane Shares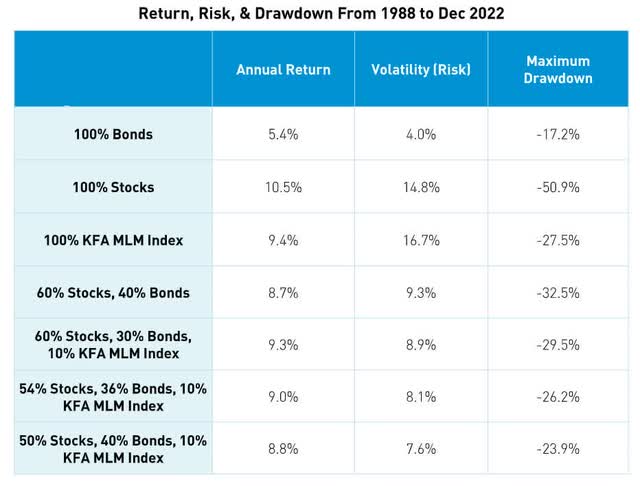
In an industry where 4.5% long-term returns are normal and where bonds deliver 4% returns, KMLM’s index, the Mount Lucas managed futures index, has doubled its peers for the last 35 years.
- 97% statistical probability that this is the Warren Buffett of managed futures
- 8.5% long-term expected returns and yield
Krane Shares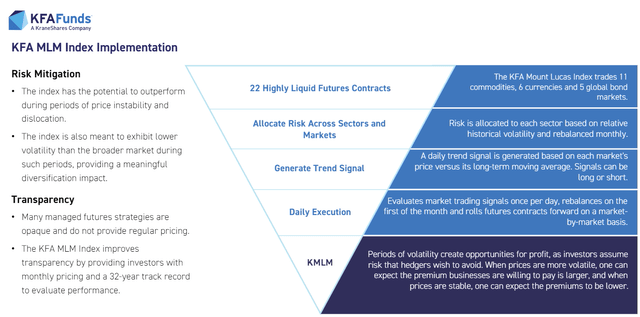
Unlike most managed futures, KMLM doesn’t have stock exposure and rebalances daily.
Not once per week (like DBMF), and the trend following algo isn’t looking at 2 months’ worth of data; this is a daily trend following.
- with safeguards to prevent head fakes
Since The Regional Banking Crisis Began
Ycharts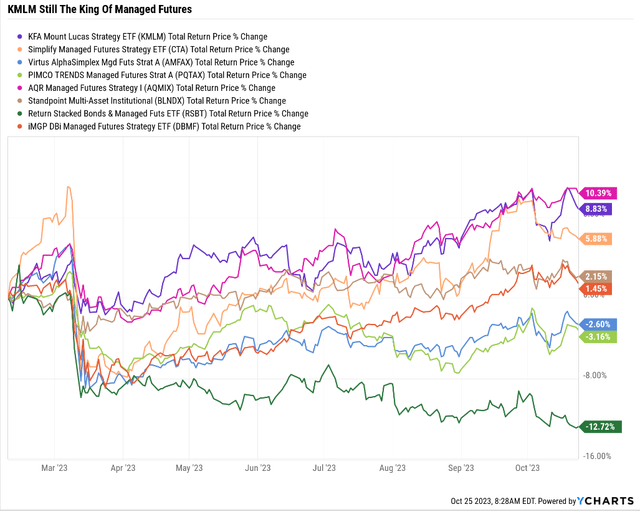
Since KMLM Started Trading
Ycharts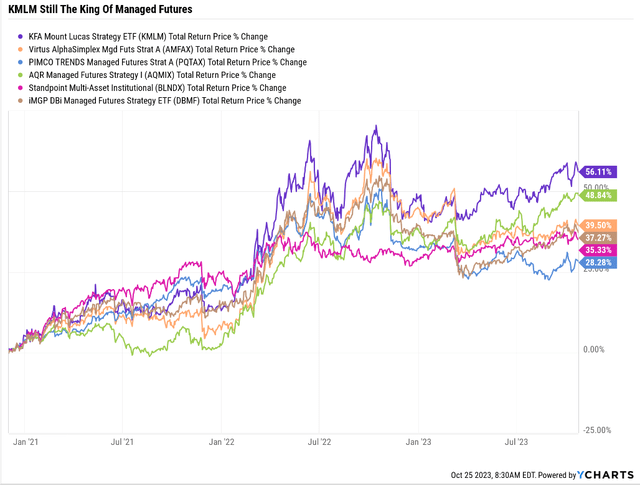
But here’s why KMLM isn’t a cash equivalent.
Ycharts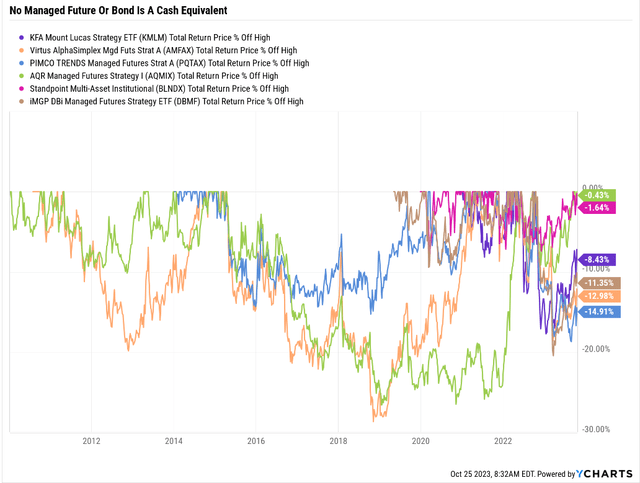
The largest decline in its index was a 28% decline from 2016 to 2019.
Managed futures are more volatile than index funds, and so are long bonds.
They are uncorrelated assets, and that is why the volatility in owning all 3 is so low.
Historical Returns Since 2007
Portfolio Visualizer Premium 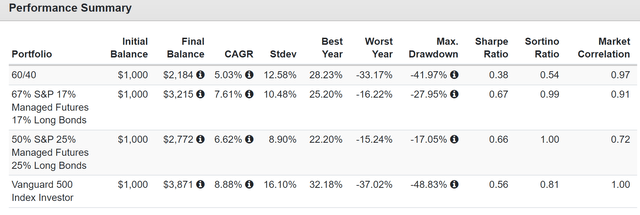
The negative-volatility-adjusted returns (Sortino ratio) are 2X that of a 60/40 and 25% better than the S&P 500.
That’s the power of stocks, bonds, and managed futures together.
But even a 17% peak decline is still not a cash equivalent for apparent reasons.
Don’t Bother Investing In Hedge Funds…Building Your Own Is Cheaper, Better, And Easy
Portfolio Visualizer Premium 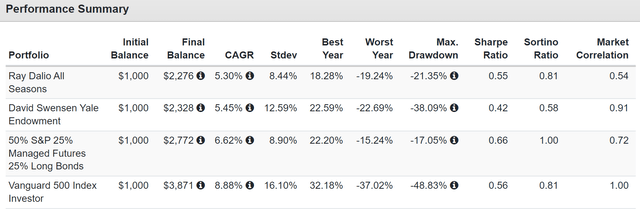
The average hedge fund charges 5% per year to underperform a very simple personalized hedge fund that will deliver superior returns, lower peak declines, and far better volatility-adjusted returns.
Not even hedge fund legends like David Swenson and Ray Dalio are worth their high fees.
Don’t Fall In Love With Cash
It’s easy to love cash for the last two years, risk-free, and we’re finally getting paid a positive real rate.
- 5.6% yield – 2.4% truflation (97% correlated to CPI but real-time) = 2.2% real rate on risk-free 6-month T-bills
If you parked your money in cash and the yields and inflation never changed, then you’d double your spending power every 33 years.
- actual cash would lose half its value every 33 years
But you need positive growth unless you’re so rich you only care about preserving buying power.
- $1 invested in US stocks in 1800 is worth $3.6 million today
- $176,000 inflation-adjusted with stocks
- $44.83 with cash (T-bills)
- 4,000X better returns with stocks than cash
OK, but how many people have a 200+ year time frame? Only Ben Franklin and his “invest to give” strategy would benefit from this, right?
Nick Maggiuli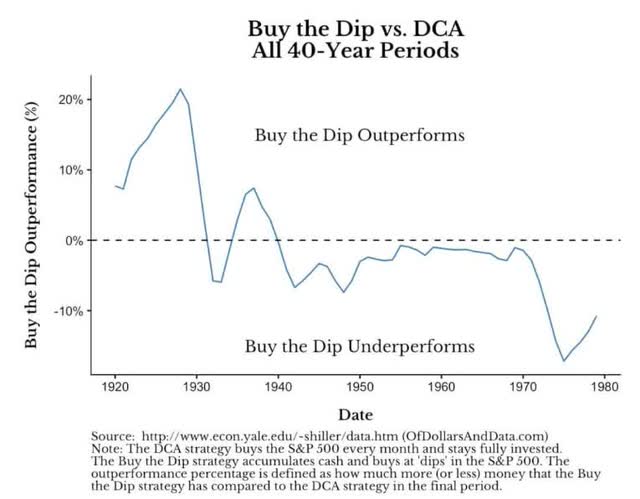
Nick Maggiulli is the Chief Data Scientist and Chief Investment Officer for Ritholtz Wealth Management.
That’s the all-star team that includes Barry Ritholtz, Ben Carlson, Michael Batnick, and so many other widely watched and read financial bloggers.
These are the financial bloggers that people in the hedge fund industry read, and they all get their data and charts from Nick Maggiulli.
And guess what his research has shown? That stocks are the best-performing asset class in history, and that buying as soon as you have money is the #1 strategy pretty much all the time since WWII.
Nick Maggiuli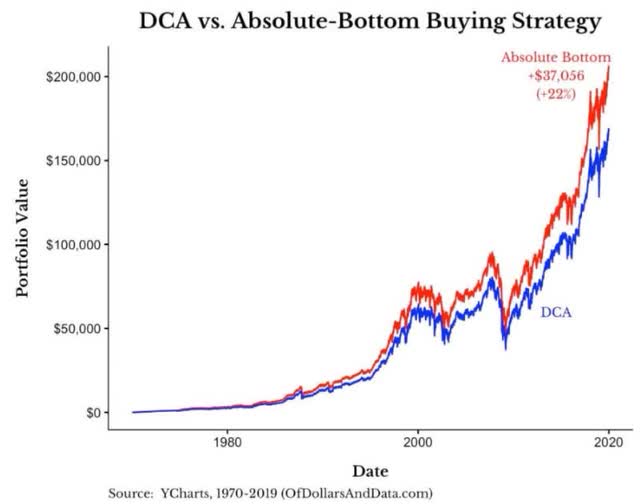
Guess what perfect market timing gets you? About 22% higher returns, not counting taxes, over 40 years.
Not 22% per year, but 22% over 40 years, 0.5% higher annual returns…assuming no taxes.
Nick Maggiuli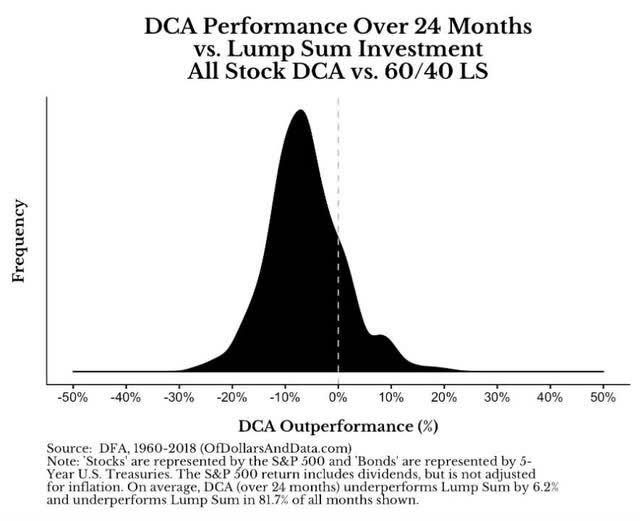
82% of the time since 1960, including the 1970s stagflation hell, investing in 60/40 beats sitting in cash.
Nick Maggiulli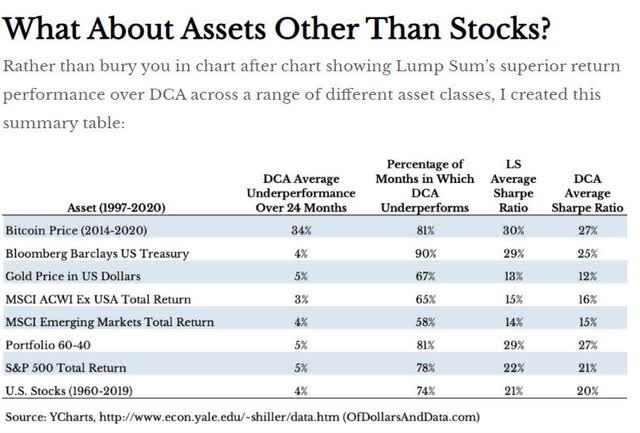
From 1997 to 2020, the modern era, US bonds have underperformed steadily, buying stocks 90% of the time.
OK, but what if Nick Maggiuli is some shill for stocks? He did write a popular book called “Just Keep Buying: Proven Ways to Save Money and Build Your Wealth,” which I have read and consider an excellent fact-based approach to sound long-term investing.
Is Mr. Maggiulli cherry-picking his data to spin a story, promote an agenda and “talk his book” as we say in this industry?
Vanguard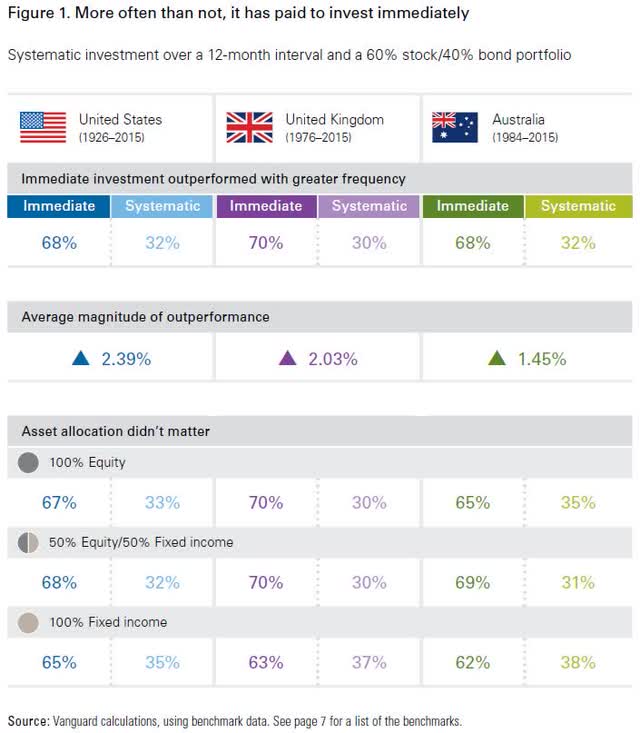
160 years of market data from three countries shows that his conclusions are accurate. About 70% of the time the optimal choice is to buy stocks as soon as you have money.
- 2.4% higher average annual returns over time
- 104% higher-inflation-adjusted wealth over 30 years
Let me put it another way.
Imagine having $500,000 at retirement age. That’s a $20K per year withdrawal under the 4% rule.
Now imagine having $1 million or $40,000 per year.
Do you think that an extra $20,000 per year in retirement income might make a difference to your standard of living?
What if Vanguard is cherry-picking its data? What if Maggiulli and Vanguard in the same cabal trying to sucker Americans into the conspiracy of investing in stocks for the long-term?
JPMorgan Asset Management 
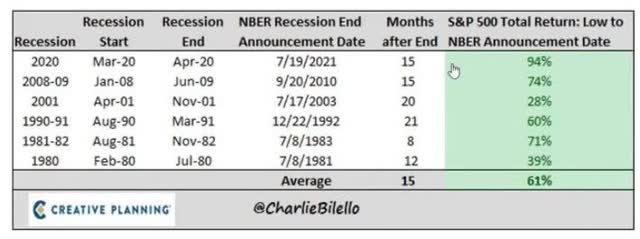
JPMorgan Asset Management confirms market timing is a fool’s errand, and Bank of America’s research shows it’s the best way to destroy your retirement dreams.
Bank of America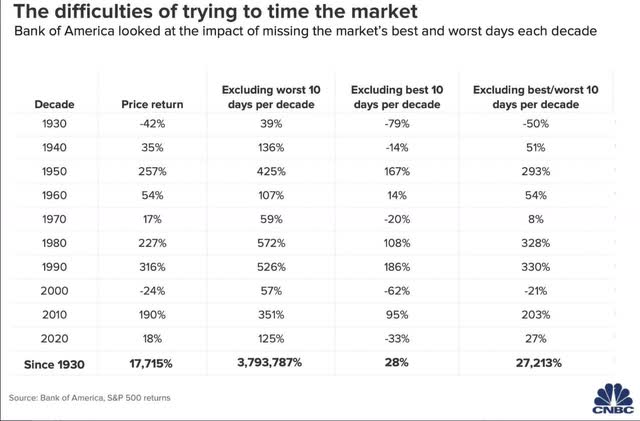
Missing just the 10 best single market days each decade, averaging just one day per year, can turn the market’s incredible long-term gains into a 94% inflation-adjusted loss.
Imagine investing for 90 years and losing 94% of your purchasing power…that’s the danger of market timing.
And that’s what anyone recommending selling SCHD today to try to buy it back later cheaper is really saying.
OK, but what if you don’t trust Ritholtz, JPMorgan, or Bank of America.
Dalbar
Investing Research Company Dalbar has found the same thing as all the others, legendary value investor Bill Miller’s “Time in the market, not timing the market”.
- Ben Graham, Warren Buffett, Charlie Munger, John Templeton, Peter Lynch, Joel Greenblatt, and Howard Marks all agree
Okay, but what if you don’t trust any of those legendary investors, literally the greatest investors to ever live, and consider Ritholtz, JPMorgan, Bank of America, and even Dulbar some evil “woke” cult?
Charlie Bilello 
Charlie Bilello is a conservative financial advisor, and he’s reached the same conclusions as every other researcher.
Not just once but numerous times.
Charlie Bilello Charlie Bilello 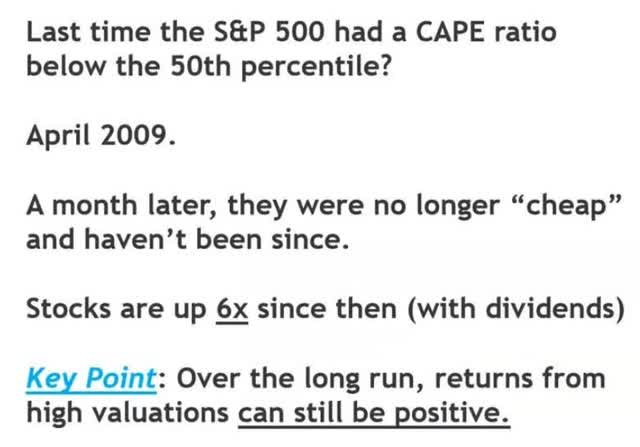
The point is that anyone telling you that cash and stocks are competing assets doesn’t know the facts.
- any money you need within 1-2 years is in cash
- the money you don’t need for 3 to 4 years can be in medium-duration treasury bonds
- money you don’t need for 5+ years should be in a more aggressive portfolio (stock-focused, like 60/40 or ZEUS’s 67/33 or more aggressive like Buffett’s 90/10 or even 100% stocks for investors with 20+ years)
Bottom Line: There Is No Such Thing As A Cash Alternative
For 15 years, cash paid negative real yield and so many investors made the dangerous mistake of thinking of bonds as a cash alternative.
Or worse yet, certain kings of stocks as a bond alternative.
Charlie Bilello 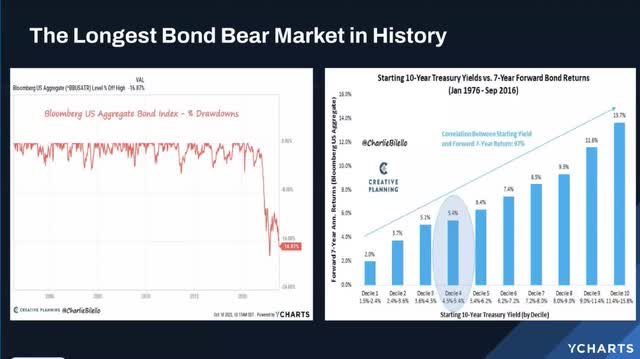
The worst bond bear market in history has proven that not even US Treasuries are cash alternatives.
- cash = perfect liquidity and no risk of losing principle
If you need guaranteed stores of value, that’s where cash shines.
XBIL today yields 5.4% after expenses and is perfectly liquid, risk-free, and pays monthly income that is helping make a dent in my family’s outrageous $25,000 monthly bills (headed to $30,000, we think in 2024).
In the unlikely but possible scenario in which inflation heads back above 5%, XBIL is going to be the fastest cash ETF to raise its yield.
Just remember that cash is a very specific tool.
Earning a 2% real yield is great, but you can’t grow a fortune with risk-free t-bills.
You can’t hedge a recessionary bear market with risk-free t-bills.
- cash = risk free emergency funds
- bonds = risk-free (long-term) and hedging recessions
- managed futures = hedging recessions
- stocks = most volatile but best-performing asset class in history
- dividend stocks = are better than stocks and generate exponentially more long-term income
- growth stocks = income growth boost when combined with high-yield stocks
Hartford Funds 
Each kind of asset has its own uses and limitations.
If you know how to use them properly, your chances of achieving your financial goals are 97%, as close to a guarantee as you’ll ever find on Wall Street.
Read the full article here
 (NASDAQ:MU)")
")
 2026-04-03")


")